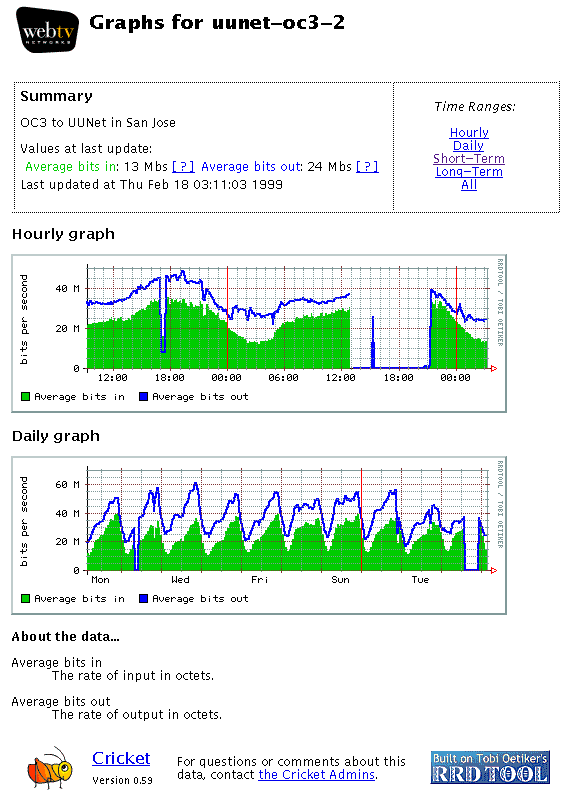
Figure 1. An example of Cricket in action. These graphs show an OC3 outage.
Jeff R. Allen
WebTV Networks, Inc.
Note: This paper was first published in the proceedings of the 1st Conference on Network Administration, which was held April 6-10, 1999. This paper is copyright 1999 by Jeff Allen. Redistribution of this paper is allowed under the GPL.
Cricket is a tool that lets users visualize a set of measurements over time. It was designed to assist network administrators by letting them see and respond to patterns in their network. In this paper, I will describe the need we saw and attempted to resolve by writing Cricket, then describe the solution we came up with. Finally, I will describe some future work we expect to do to make Cricket a more proactive monitoring tool.
When running a complicated network, there are a multitude of things one needs to keep an eye on. Clearly, immediate concerns like connectivity, link status, and routing stability are top in most administrator's minds. Long-term issues like architecture and technology decisions float in the back of our minds. Often, that leaves no room for the most interesting questions, which help with both short term issues and long term ones. Some of the questions we found ourselves asking about various network components were:
Taking the time to ask these questions allows us to step up a level in our monitoring, and move from a reactive realm (i.e. Is the link to Europe up?) to a more contemplative and predictive realm (i.e. Are we seeing an unexpected burst of traffic to Europe?) It's obviously not possible to definitively say that this makes our job easier and our network run more smoothly, but it certainly seems that way. Simply having the data available to be able to say ``things look OK'' gives us a peace of mind that simply reacting to the network would never give us.
Figure 1 shows a screenshot from Cricket, showing the normal way that data is displayed about a target. In this case, we are looking at the traffic on one of our OC3's, which was operating normally until an outage started a little after noon. From this same view, we can tell that in the last week, the peak bandwidth in use on this link was 60 Mb/sec, on Wednesday evening. By glancing at one page, we can answer many of the questions posed above. By looking at longer time scales (accessed via the links in the upper right) we could answer still other questions about the long-term behavior of the traffic on this link.

Figure 1. An example of Cricket in action. These graphs show an OC3 outage.
One of the reasons it's hard to monitor a network is that there are a lot of different components, each with different operating characteristics and monitoring needs. For instance, in our network, some of the components that we use Cricket to monitor are:
Note that we monitor some things (DNS, hosts) that are not directly related to the health of the physical network. In our shop, the ``host folks'' and the ``network folks'' work together very closely. There is no artificial separation between the two. I will focus on monitoring the networking components, however, keep in mind that Cricket is capable of monitoring many types of components.
Just as the components we wish to monitor are varied, so are the ways in which we talk to them. Sometimes, we can simply talk SNMP, then either record the data directly or do a bit of post-processing to derive a rate of some kind. Other times, we fetch data via SNMP, then post-process it in some more complicated way to get a final data point. For instance, to monitor modem bank usage, we fetch the current state of all the modems, and count the number that are off-hook. Sometimes we simply run a shell command on another data-gathering system. For instance, we can use Unix tools like 'wc' or simple Perl scripts to derive a data point from the data already collected by syslogd. Finally, sometimes we want to measure and observe an aggregate of other data sources. In a site with multiple Internet links, it would be interesting, for instance, to plot the total Internet bandwidth across all links.
Around the time we1
were bringing up the WebTV network, we fetched and
installed a tool called
MRTG2
to let us start answering the kinds of questions mentioned above about
our WAN links. In fact, MRTG was in use at WebTV Networks before we
had brought in any commercial network management tools at all.
It was only by using, and coming to depend on the MRTG graphs,
that we were able to take a step back and figure out why they were so
useful to us. After getting ourselves thoroughly addicted to MRTG,
even while attempting to roll out another network management system,
we were forced to ask the question,
``What is it that MRTG does that we can't get elsewhere.''
The answer to that question makes up the bulk of the first section:
MRTG let us manage our network better than reactive systems.
So, there we were, addicted to MRTG, using it in new situations and in
ways it was never designed to be used. MRTG started showing signs
that it would not scale to handle the new jobs we wanted to throw at
it. Something needed to be done, and quickly. A true addict will not
wait patiently for a new drug!
Before we threw out MRTG and started over, we thought it might be a
good idea to figure out what it does right, and make certain that
whatever we got to replace MRTG could at least do those things. Each
view of the data has just enough detail to tell the story, but not
enough to hide the good bits. For instance, the weekly views show
today and this day last week. There is an enforced data density so
that graphs have just enough data to tell an accurate story, but not
enough to overwhelm the viewer. In addition, the auto-scaling feature
consistently produces readable graphs (though there is a bit of room
for improvement on this front). It uses a fixed size database which
grows linearly with the number of monitored devices, not time. It
needs no extra
``cleanup''
work. Because MRTG is web-based, we have a platform independent tool:
all it takes is a web browser to check the status of the network. You
can even use a WebTV®-based Internet Unit to see graphs of
your network on your home television!
Perhaps more important than all that, though, MRTG passes the
``can it solve real problems''
test:
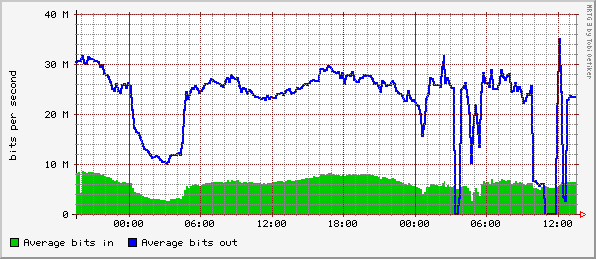
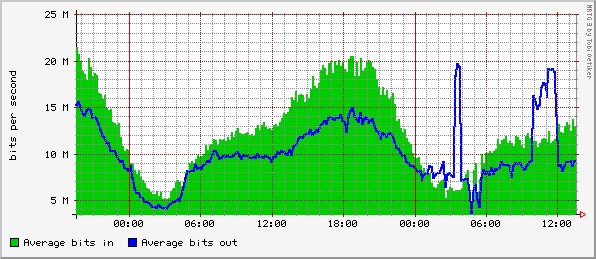
To see how we use graphs to identify and understand real problems,
examine figures 2 and 3. These two graphs are selected snapshots of
the graphs available to us during backbone routing instability on one
of our peer's networks. During this event, it's clear that about 10
Mb/sec of traffic shifted over to the second peer. We were able to use
Cricket to find the nature of the problem, see that the outbound
traffic had failed over to non-optimal, but functional link, and
finally verify that the traffic returned to normal after the event.
Figure 2. Traffic on a Fast Ethernet handoff to a peer of ours.
Their backbone was suffering routing instability at the time.
Figure 3. Traffic on a DS3 to another peer during the
routing instability shown in Figure 2.
Finally, Cricket passes the
``manager test''
with flying colors.
Managers immediately understand the need for a bandwidth
upgrade once they see a graph produced with MRTG. Even more
astoundingly, it even passes the
``executive test''
which is very
important since executives tend to need to sign orders for OC3's and
above. The simple web-based user interface makes it easy to print and
share the graphs with management, making it easier for everyone to do
their job.
Regardless of all these great features, we identified problems we
wanted to address in the next generation system. First, MRTG has a
narrow view of the world: all targets have exactly two data sources
(used by MRTG for bandwidth in and bandwidth out). We wanted to be
able to measure other things about components. MRTG also has severe
performance problems, resulting from the way it reads and writes
data. MRTG was incrementally developed and the performance problem
only became apparent after it was too late to fix it. Usually, it's
not an issue, because MRTG is mostly used in small installations.
However, with all the different ways we were trying to
use MRTG, performance became a problem for us.
There are ways to overcome these performance problems by arranging to
run multiple instances of MRTG in parallel. However, the configuration
needed to run it in parallel is even more complicated than the usual
configuration. For our varied uses, the configuration was already
unwieldy and inefficient. The last thing we needed was to make it even
more complicated!
Some might recommend commercial products as a replacement for MRTG,
since commercial products are supposed to be designed to scale well
and be easy to configure. Our experience is that commercial tools
introduce as many problems as they purport to solve, and often leave
the original problems (scalable performance and configuration)
unsolved. Here's an undoubtedly one-sided list of the problems
inherent in most commercial tools that could have helped us.
First and foremost is cost. It's expensive to make good software. No
one will argue that point. In fact, it has been more expensive than we
expected to develop Cricket. But when buying an expensive network
management tool, things get ugly. It takes too much time, paperwork,
patience, and persuading management, even if you do have the budget
for a commercial tool. Evaluating and rolling out a free software
package can happen in an afternoon, if you put your mind to
it. There's simply no downside risk - install it and if it solves
your problem, keep it. If it doesn't meet your expectations, delete it
and move on. You get what you pay for, but sometimes it's what you are
not getting (support hassles and licensing nightmares) that really
counts.
With commercial tools, database formats are often secret, API's
(usually only available at extra cost) are either a pain to work with,
or are major performance pigs. Customer support varies, but the simple
fact is that even stellar customer support won't do for you what
getting your own two hands dirty in the code will do: give you a deep
understanding of your NMS and the confidence to trust the system and
your ability to operate it. Then, there's the version tango. The NMS
doesn't find out about new router models until 6 months after you've
already deployed them because the router company and the NMS company
are feuding. The trouble-tracking system you are using is only
certified to talk to the next version of the NMS that you cannot use
yet because that version introduces a critical bug that no other
customers are seeing, and thus, will not get repaired until you
threaten to revoke your support license - which, by the way, does not
expire until next December.
Finally, let's be honest: Free Software rules. Who would you rather
trust with the smooth operation of your network, a bunch of folks who
are in the same boat as you, or a giant vendor with 100-page
implementation plans and slick salesmen? The choice is obvious, to me
at least: network managers design better tools to do their
job3.
Sometimes commercial tools are the right tool for the job, but in this
case, it made more sense to go at it on our own. It will make even
more sense for your organization, since WebTV Networks has
done much of the hard
work. All you need to do is download, install and configure
Cricket.
The solution comes as two pieces, a new database and a new
user-visible front-end. By changing out the back-end, we addressed the
flexibility and performance goals. By changing out the front-end, we
improved the user interface, both for configuring the system and
viewing the graphs. The two pieces are developed semi-independently,
one by me (in California) and one by the original author of MRTG,
Tobias Oetiker (in Switzerland). Keeping the two pieces separate makes
it easier to develop them, and it also means the database component
can be reused in other contexts. RRD, the database backend,
is distributed separately from
Cricket4.
We are deeply indebted to Tobias for his hard work on the database
back-end. Without it, Cricket would be nothing. By engineering RRD
correctly from the start, and by improving it's reliability over the
last year, Tobias solved over half our problems with MRTG himself. I
simply had the easy job of passing the right data into his code. All
the seeming magic of Cricket comes from Tobias's RRD code.
The next generation back-end is called RRD, the Round Robin Database.
It takes over exactly the same jobs the back end provided with MRTG
did: storing and rolling up the data and generating graphs from the
stored data. RRD is written in C, and comes in both a Perl module and
a command line version, which can be used interactively or across a
pipe from scripts. It can be used either directly by simple
scripts, or via frontends like Cricket. Other frontends are available
from the RRD website.
RRD achieves high performance by using binary files to minimize I/O
during the common update operation. The
``round robin''
in RRD refers to
the fact that RRD uses circular buffers to minimize I/O. RRD is at
least one, and possibly two orders of magnitude faster than MRTG's
backend, depending on how you measure it. It's truly incredible to
watch it chew through data if you have ever seen MRTG trying to handle
the same job.
RRD is more flexible than MRTG in at least two dimensions. First, it
can take data from an arbitrary number of data sources. MRTG was
limited to two datasources. Originally they were reserved for input
bandwidth and output bandwidth, though they got co-opted for other
measurements by many MRTG hackers. RRD can also keep an arbitrary
number of data arrays, each fed at a different rate. For instance, you
can keep 600 samples taken every 5 minutes alongside 600 samples
taken every 30 minutes. Thus, you can have 5 minute data stretching back
50 hours into the past, and 30 minute data stretching back 12
days. When you draw a graph of this data, you can see recent data in
high resolution, and older data in lower resolution. This is one of
the original features of MRTG that made us so happy. In RRD this
feature is completely configurable.
RRD stores data with higher precision than ever before (float versus
integer) which allows us to measure bigger things (OC3's) and smaller
things (Unix load averages) without relying on goofy scaling hacks, as
we were required to do with MRTG. The data file where this data lives
on disk is still a fixed size over time, and scales with the product
of the number of datasources and number and sizes of the data
arrays. The data storage in use for an entire installation still
scales linearly with the number of targets under observation. At WebTV
Networks, we have Cricket configured to store 6 variables for every
router and switch interface. Each interface requires 174 kilobytes on
disk, which is enough room to store all the data for 600 days. Of
course, your mileage may vary; Cricket is configurable, so you can
choose to keep more or less data, depending on your needs.
RRD still provides the same simple, sparse graphs we grew to love
while using MRTG. There is now much more flexibility at the time the
graph is generated. For instance, we can choose to show some data
sources, but not others. We can choose to scale a data source using an
arbitrary mathematical expression. For instance, we can fetch the
temperature from a router in Celsius, and present it to the user in
Fahrenheit. Since almost all data seems to arrive in exactly the wrong
units, it's quite helpful to have this flexibility. Do you think
about Ethernet capacity in
``megabytes/sec''
The scaling feature
lets us turn that measurement into
``megabits/sec''
It is also possible
to integrate data from multiple sources into a single graph. For
instance, you could make a summary graph showing the sum of the
traffic across all of your Internet links.
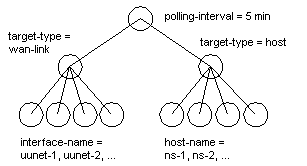
Figure 4. A simplified example of a config tree.
Recall that part of the problem was flexibility and performance of the
database, both of which RRD solved. The other part of the problem was
scalability of the configuration. Our solution
is something called the config tree. A config tree is a set of
configuration files organized into a tree. This hierarchical
configuration structure allows us to use inheritance to reduce
repeated information in the configuration. To simplify implementation
of the config tree, the inheritance strictly follows the directory
structure; complicated concepts like multiple inheritance are not
supported. The attributes that are present in a leaf node are the
union of all the attributes in all the nodes on a path leading from
the root of the config tree to the leaf node. Lower nodes can override
higher nodes, so it's possible to make exceptions in certain subtrees,
and do other clever sleight of hand.
It's easier to understand the config tree by looking at an example
(see figure 4). Attributes that all of the system will share are
located at the root of the config tree. For instance, the length of
the polling interval is set there. At the next level, we set
attributes that will be restricted to the current subtree. At this
level, typically you will find the target type. Finally at the lowest
level we set things that will vary on a per-target basis. For
instance, we set the interface name that we are trying to measure
here. By using the power of inheritance, you can avoid repeating the
information at the top of the config tree many times near the bottom
of the config tree. The three level config tree in the example is the
simplest in common use. The one that ships with Cricket in the
sample-config directory works like this. Config trees can and do have
many more levels. At WebTV Networks, for instance, we add levels to
break apart routers in different data centers to make the directory
listings more manageable. There are no built-in limits on the shape of
the config tree, only practical ones.
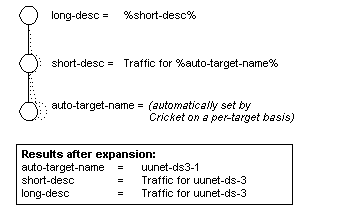
Figure 5 shows the power of the string expansion feature in
Cricket. When it comes across strings in the config tree with special
markers in them, it expands the strings in much the same way a
scripting language expands variables. The sample config tree that
ships with Cricket uses this feature in several places to dynamically
build strings from settings already available. In the example, the
short and long descriptions for the target are set based on some data
inherited from high in the tree, and other data related to the target
itself. In order to make this feature even more useful, we introduced
auto-variables, which are set to certain strings automatically by
Cricket. They are available for use by expansions, making it possible
to automatically generate things that change for every target, like
the data file location. The same expansion system is currently used to
make it possible to customize the HTML output of the user interface
component, though it is still not yet as flexible as we would like it
to be.
Figure 5. An example of variable expansion.
Cricket's collector is single-threaded, and thus spends a fair amount
of time waiting for data to arrive over the network. The wall-clock
run time for each instance of the collector is limited to the length
of the desired polling interval (or else you might miss polling
cycles, which would be unfortunate). Thus, the number of targets that
can be polled by a single collector on a single host is limited. To
get maximum polling capacity, it is necessary to run several
collectors in parallel, each working on a different subset of the
total set of targets to be polled. This was hardly a surprise to us,
since we needed to use the same technique to boost the performance of
our MRTG installation. In fact, we designed the config tree to make
partitioning the set of targets easy, so parallelizing Cricket is
simply a matter of starting the right collectors at the right time,
each operating on the right subtrees of the global config tree. There
is a wrapper script for the collector which does this, as well as
other housekeeping chores like managing logfiles, and checking
them for errors.
The config tree has several other advantages we stumbled upon after
using it for a while. Because the subtrees are mostly independent from
one another, multiple administrators can work on the config tree
without impacting each other. The hierarchical structure makes it
simple to make standards that apply across all the different
applications. It also makes it possible, when necessary, to make
exceptions for certain devices. Of course, in a perfect world, this
wouldn't be necessary. But this isn't a tool for a perfect world, it's
a tool that was written to solve problems in the real world. Sometimes
it just happens that we need to query one device with different OID's,
or that the community name is different on a certain device. At the
same time, though, a properly designed config tree can save you a lot
of work when you decide to make some kind of wide-spread change to the
system. Instead of changing the data everywhere, you can change it in
one place.
Contemplating our fully populated config tree gave us another
idea. One of the hardest parts of maintaining a suite of network
management products is trying to keep their configurations up to date
and in sync with one another. What if we declared, by fiat, that our
Cricket config tree was the one true source of configuration
information, and that all others should be derived from Cricket's
config tree? We decided to design the config tree to be a simple
collection of dictionaries. As the config tree is read the parser pays
no attention to what keys and values it finds. It simply stores them
away. Later, the application which called the parser (Cricket in this
case) does lookups in the dictionary looking for data it understands
which will control its behavior. Since it is doing lookups into the
data, it never even sees data that it's not interested in. In theory,
lots of different tools could all rely on the config tree, leveraging
the investment made into creating and updating a config tree. In
practice, a fair amount of code that belongs in the parser ended up in
the Cricket application itself, which means that it will take some
reengineering to make the dream of the One True Config Tree come true.
The fastest, most flexible data collection on the planet doesn't help
at all if there's no way to see the data. MRTG led us down the right
path here; the graphs it makes are simple and useful, and they are
presented in a web page viewable on virtually any platform. For
Cricket, we decided to make the HTML and the graphs on the fly,
instead of caching completed graphs like MRTG does. This saved some of
the processing overhead inherent in MRTG's regular polling cycle. As a
bonus, using the CGI script instead of pre-generated HTML soundly
defeats the over-aggressive browser-side caching that plagues many
MRTG installations. On the down side, the startup time for the CGI
script can be a problem, as can the graph generation time,
both of which the
user perceives as lag in the user interface. The startup time problems
could be mitigated by the mod_perl Apache module, and Cricket already
uses a graph caching scheme to attempt to avoid wasting time
re-rendering graphs. It's generally true, though, that the Cricket
user interface is slower than the MRTG interface.
The CGI graph browser was specifically designed to maximize
flexibility. It is read-only, which keeps security concerns to a
minimum. If access control to sensitive information is required, it is
currently only possible on a per-installation basis. This is one
drawback to the CGI graph browser, but it has not been a problem for
us. There are also ways to run a graph browser on a subset of all the
collected data, so access controls could probably be implemented by a
determined Cricket user. The graph browser operates entirely on URL's
which can be incorporated into web pages outside the Cricket system,
or stored as bookmarks. This has made it possible to build
``views''
of the Cricket data which are annotated in various ways to assist
operations personnel. We can also use these external pages to collect
a set of interesting graphs which might be difficult to navigate among
inside the graph browser.
To aid in analyzing the data, it can be useful to assemble graphs out
of various data streams which are separately collected and stored by
Cricket. So far, this capability is limited to putting multiple graphs
on one page, and gathering data from several sources and plotting it
in summary on a single graph. These advanced features intended to make
it easier to look at the data are a tough sell; they tend to be
difficult to implement within the current design, and are only used when
trying to solve a particular kind of problem. Of course, having the
right tool for the job is invaluable, so it's tempting to try to make
Cricket do everything under the sun.
While Cricket
is the right tool for these analysis jobs, it's not yet infinitely
flexible. It presents useful data that answers 90% of the questions,
but the jury's still out on the costs and benefits of adding the
complexity necessary to answer the last 9% of the questions. What
about the last 1%? We'll never get there, and we don't plan to
try. Sometimes, the data suggests questions that are better answered
with other tools. The trick is knowing when to turn elsewhere to get
your answer.
MRTG relies on SNMP instance numbers to identify which of the
interfaces on a given router it will pick up data from. One of the
things we knew we hated about MRTG was the necessity of re-adjusting
instance numbers after any router configuration change. It was a
small, but persistent, pain in the neck. It's a dreadfully mundane
job, and especially annoying on the large routers we use, which have
lots of interfaces. Still, it didn't happen that often, and it hardly
showed up on the radar screen of
``things we want to improve in MRTG''
To be fair, the instance number problem is not even really MRTG's
fault. It's due to an annoying compromise in the SNMP specification
that lets network devices get away with murder in the interest of
making them easier to implement. This was done under the assumption
that polling systems will be smarter than network devices, and can
make up for the lack of intelligence in the managed nodes. SNMP
devices are allowed to renumber their interfaces behind the poller's
back potentially between every single polling cycle. What's a poller
to do? The system can either force humans to fix things up when
necessary, or it can attempt to figure out the right instance number
on it's own. MRTG uses the former strategy, while Cricket has a
feature called
``instance mapping''
to implement the latter strategy.
Cricket's instance mapping feature allows administrators to configure
a target by name, and then let Cricket do the necessary SNMP lookups
to map that name into an instance number. From then on, it's Cricket's
job to keep the instance number correct, no matter how hard the device
tries to confuse it. Cricket does this magic in a bulletproof but
efficient way. To begin with, it uses a series of SNMP GET-NEXT
operations (i.e. a table walk) to map the instance name to a
number. Once it has a valid instance number, it caches it. The next
time it uses the cached instance number, it fetches the name again,
along with the polled data. If a
``no such instance''
error is returned, or the name no longer matches, Cricket discards
the polled data, maps the name to a new instance number, and fetches
the data again. The new instance number is cached, and will be used
until the next re-mapping is required. Fetching the name every time
like this amounts to a small overhead in the polling transaction, but
it ensures that re-mapping happens as soon as necessary, without any
human interaction. Presumably commercial systems solve this problem
the same way.
It turns out that this is not just a nice feature, it's a required one
in some cases. It was designed to be extremely flexible, since I hope
to use Cricket to monitor items in the Host MIB which tend to get
different instances all the time (disks and processes, among
others). To this end, Cricket can even match against names which are
regular expressions, making it easy to find a given process, no matter
how it was invoked. I have also been told that the virtual interfaces
created and destroyed by Cisco's ATM LANE implementation come and go
with unpredictable names, making them very hard to monitor with
conventional tools. A Cricket user managed to monitor these virtual
interfaces for the first time ever using the instance mapping code and
regular expression matching. His exact comment on the triumph was
``Instance mapping is the best thing since sliced bread!''
Our hope for Cricket is that it finds a place in other operations
centers, and that it helps improve customer service all around. Poor
service reflects poorly on all of us, and it's in the industry's best
interests to develop useful tools to raise Quality of Service.
The major features we needed from Cricket are in place now, and it has
superseded MRTG at WebTV Networks.
The bulk of the work is done. However, there
is the usual laundry list of
``todo''
items for Cricket. We will do ongoing work on it, especially to
integrate patches from interested helpers.
As we have come to depend on graphs to tell us about the state of the
WebTV Service, we have stumbled across a principle that should have
been obvious to start with. Simply put, lots of graphs are not a
proactive tool. It's not reasonable to expect humans to continually
review each of the over 4000 graphs we can produce and watch for
anomalies. Of course, Cricket was never intended to simply find links
that are down, or hosts that are crashed. There are other tools that
we already use for that kind of monitoring. Subtle problems in the
system manifest themselves as subtle changes in the patterns on the
graph. It is these problems that we seek to discover when we humans
browse the graphs. We are looking for graphs that don't
``look right''
The obvious solution to the problem of too many graphs is to ask
Cricket itself to evaluate the graphs and flag those that don't
``look right''
for further analysis by a human. This is about the time things get
really complicated; we could apply all the fancy pattern recognition
tools that the computer science community has to offer, including
neural networks, signal processing, and fuzzy logic. We took a more
pragmatic view and asked the question,
``How do we humans know when it looks right?''
The answer in all cases was that we compare the current behavior to
past behavior. Now the problem looks a bit more solvable. We want to
create a system of thresholds which are set differently at different
times of day. These thresholds will be derived from past data, so that
deviation from past patterns results in violated thresholds, which in
turn results in an alert that a human sees. With an appropriate GUI,
administrators could adjust the suggested thresholds to avoid false
positives. They could also mark known anomalous data with the GUI, so
that future generated thresholds would not be affected by the
``bad''
data.
We have asked a group of students from Harvey Mudd College to work on
this problem as part of the Computer Science Clinic program. The
Clinic program offers a team of undergraduates a chance to work on a
real-world problem, while offering companies like
WebTV Networks access to
bright students who can pursue a project independently. I work less
than an hour a week with the team as a liaison to help them understand
the problem and our expectations. In return, they are responsible
for managing themselves and delivering a finished product at the end
of the school year.
The threshold system the clinic team is working on will store its
data in the config tree. It will take advantage of inheritance to
eliminate duplicated thresholds. It will have a GUI that can be used
to look at and modify the suggested time-based threshold curves which
are generated using historical data. Threshold violations that are
discovered by the collector as it fetches the data will either spawn a
shell script, or forward the alert to an alert management system via
SNMP traps. The result of the project will be incorporated into the
standard Cricket distribution later this year. It will be available under
the same license as Cricket itself, the GNU Public License (GPL).
Of course, the real future for Cricket lies with all of the other
folks who pick it up and use it. Because it is distributed in source
form, and is protected by the GPL, Cricket users are guaranteed the
right to hack on it however they see fit. If you need Cricket to do
something it cannot already do, you can write the code and share it as
contributed software or as a patch. I'm looking forward to hearing
from Cricket users about how it's working for them, and seeing what
features they need to add to make it work even better.
The Cricket homepage is at:
http://cricket.sf.net/.
There's more information there, including the Cricket distribution,
where to get the other things you need to make Cricket work, and what
mailing lists you might want to join for help. People who want to get
in touch with me personally can send e-mail to
jra@users.sf.net.
Cricket would not have been written if WebTV Networks had never gotten
so addicted to MRTG. So hats off to Tobias Oetiker for a great tool,
and for coming through with RRD, a perfect encore. Lots of the ideas
for how to improve Cricket came from Jeff Jensen, one of the network
administrators at WebTV Networks. The WebTV Networks management lets
me spend time on this project, and chose to make it freely available
on the net, to boot. Laura de Leon reviewed this paper and helped me
spot some unanswered questions. Thanks to you all for your help.
2.
More information about MRTG is available from
http://www.mrtg.org.
3.
Writing code is another issue entirely. As a toolsmith, my job is
to write the tools WebTV employees need to do their work. Much as they
might like to, the network administrators at WebTV Networks don't
normally have the time to hack the Cricket code.
4.
The RRD website is at:
http://www.rrdtool.org/.
Why Not Commercial Tools?
The Solution
RRD: The Round Robin Database
The Config Tree
The User Interface
Instance Mapping
Future Directions
Availability
Acknowledgments
End Notes
1.
Actually, this was before I arrived at WebTV Networks.
Joe Balboa originally brought MRTG to our company.